< Back to all data
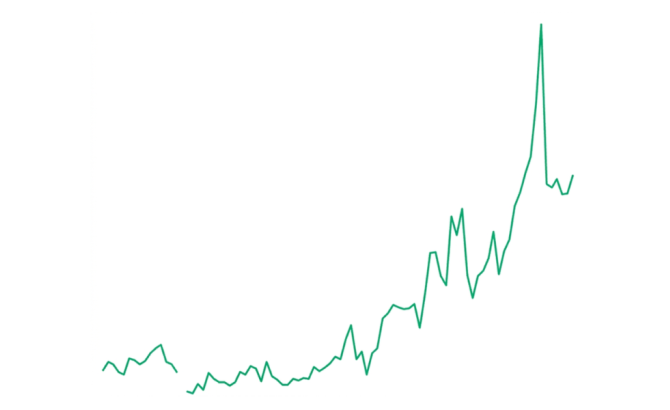
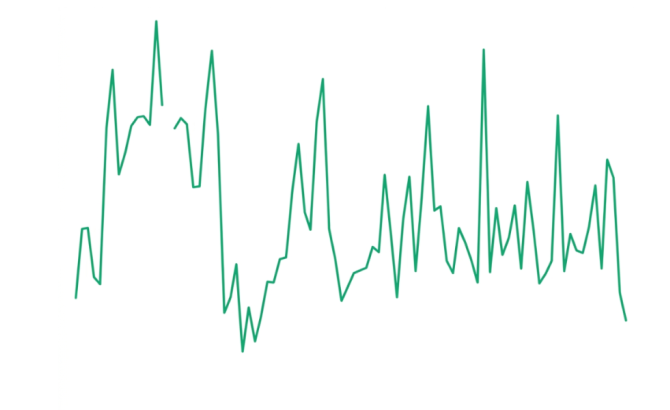
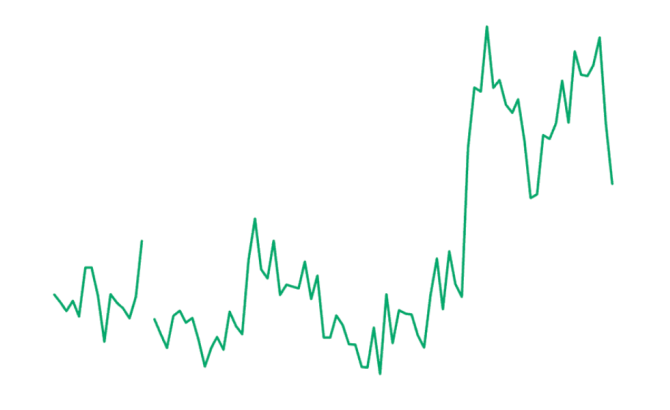
Drug consumption over time (average mg/day/1000 population) 2019/20 - 2023/24
Data date: Jun 30, 2024
Posted: Nov 21, 2024
This article was published 23 months ago. Content may no longer be relevant.
The wastewater drug testing data presented in the graph has been obtained from the National Drug Intelligence Bureau.
Wastewater testing is only able to quantify the total volume of drugs consumed in a given catchment area, and is not able to provide us with patterns of use among people living there. For example, we don’t know if a larger volume of drugs detected is associated with a larger number of people taking them, an increased concentration of the active substance in the available supply, or an increase in consumption by the same number of people.